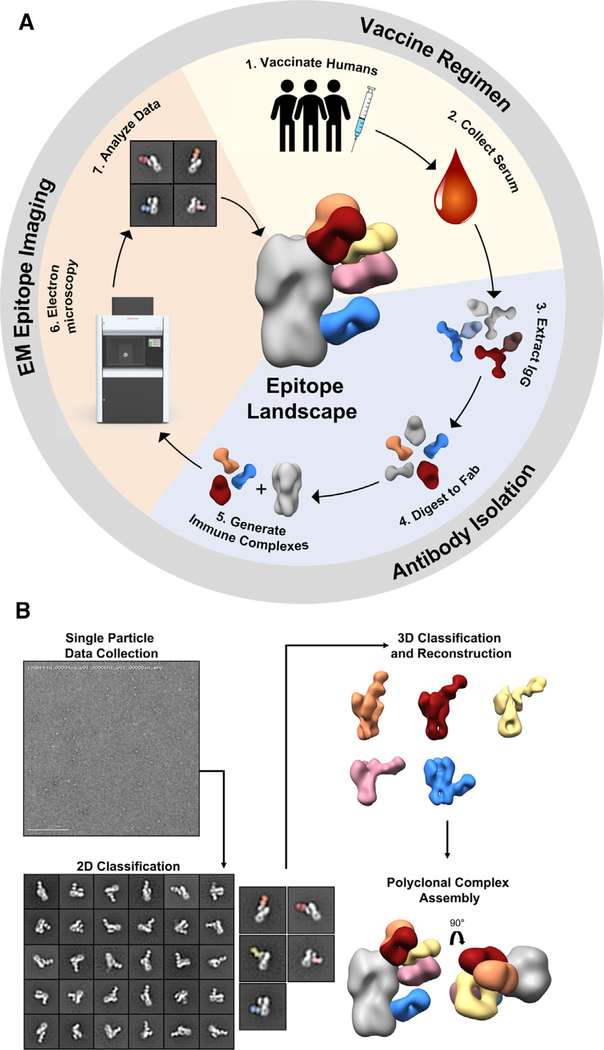
Figure 2. EM polyclonal epitope mapping (EMPEM) generates epitope landscapes from single particles.
(A) Overview of EMPEM technique. In the vaccine regimen stage human subjects are immunized (1) and serum samples are collected throughout the course of the trial (2). During the antibody purification stage, IgG is extracted from serum samples (3) and digested with papain to Fab (4). Resulting Fabs are complexed with antigen (5). In the EM epitope imaging stage, immune complexes are imaged by EM (6), single-particle EM data are analyzed (7), and epitope landscapes are assembled.
(B) Overview of EM data processing steps. Single-particle EM data are collected, and particles are categorized into 2D class averages. Scale bar represents 200 nm. 2D classes of immune complexes are further categorized by another round of 2D classification and subjected to 3D classification and refinement. Finally, polyclonal complex assemblies are generated by segmenting and resampling densities corresponding to each Fab and mapped onto an HA trimer.
See also Figure S2.

