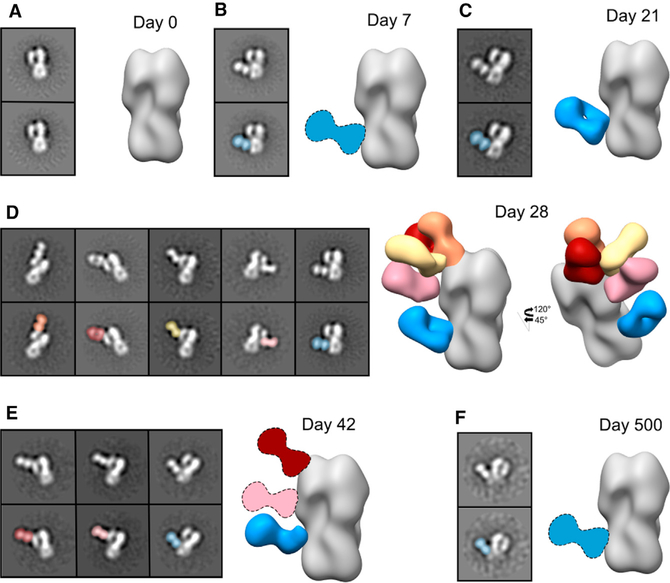
Figure 3. Kinetics of the polyclonal antibody (pAb) response to H5N1 vaccination in subject 4.
Negative stain EM reconstructions of subject 4 pAbs in complex with recombinant H5 HA (A/Indonesia/5/2005) at days 0 (A), 7 (B), 21 (C), 28 (D), 42 (E), and 500 (F) after vaccination. Top left panel: representative 2D class average. Bottom left panel: 2D class average with the Fab labeled. Right panel: side view of polyclonal immune complexes. Stem specificity, blue; RBS-proximal and lateral patch specificities, red, orange, and yellow; vestigial esterase specificity, pink. Due to limited particle representation, Fab graphics with dashed outlines are predicted placements. See also Figure S3.

