
FIGURE 2.
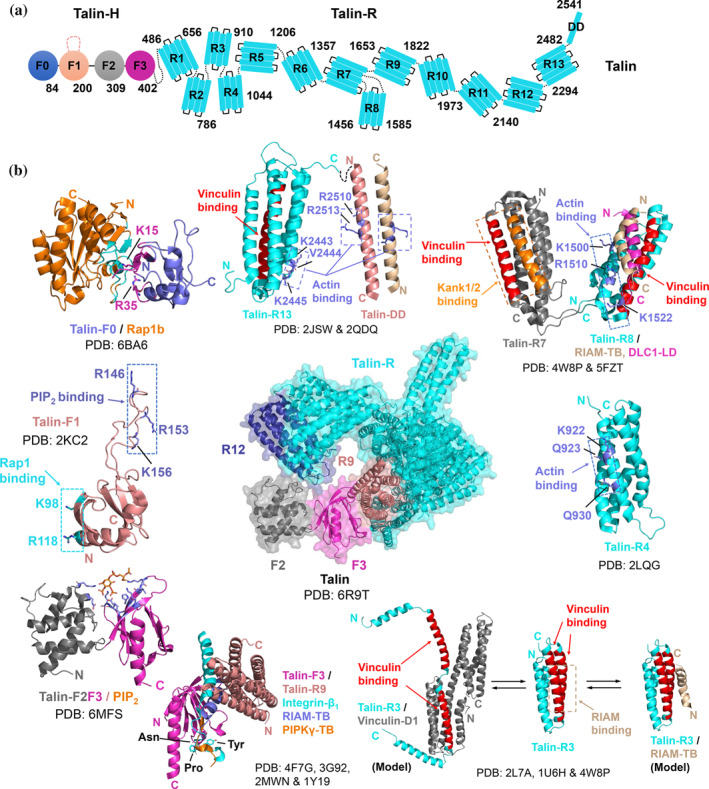
The binding interfaces of talin‐mediated interactions in integrin and FA signaling. (a) Domain organization of talin. (b) Reported structures of individual domains of talin in apo or complex form. The binding interfaces/sites for target proteins are indicated in the figure. Important residues involved in the binding interfaces or targeted in mutagenesis studies are shown in stick representation. The interface residues of talin‐F0 and Rap1b (within a cut‐off of 5 Å) are colored in magenta and cyan, respectively. The interface residues of talin‐F2F3 (within a cut‐off of 5 Å) that interact with PIP2 are colored in blue and shown in stick representation. N and C indicate the N‐terminus and C‐terminus of the protein molecule, respectively. PDB codes used to generate the figures are indicated