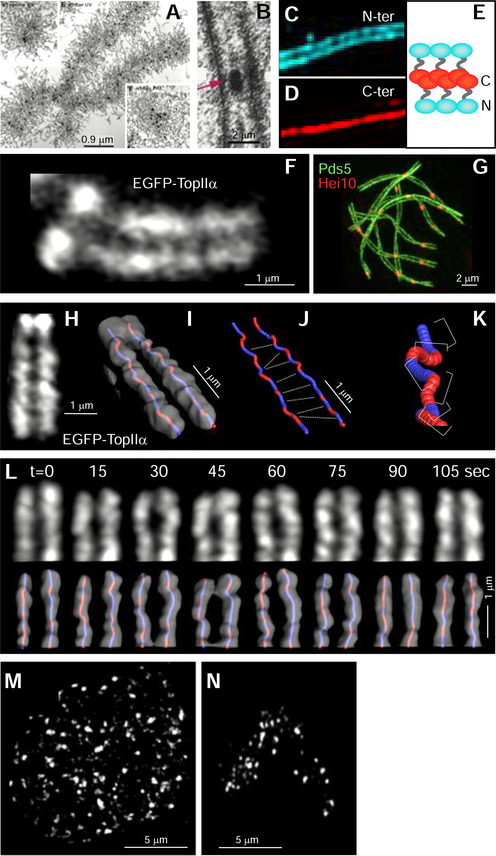
Figure 2. Whole chromosome imaging.
(A) EM images of an isolated mitotic chromosome (Maeshima et al., 2005). (B) EM image of a 3D section showing a segment of synaptonemal complex (SC) with associated crossover recombination complex (arrow) (Zickler and Espagne, 2016). (C-E) 3D-SIM images of the SC transverse filament protein GFP-tagged at the C-terminus (C) or the N-terminus (D) reveal molecular orientations of dimer complexes (E) (Dubois et al., 2019). (F) 3D Airyscan snapshot of EGFP-TopIIα in a living cell reveals the bulky mitotic chromosome axis meshwork and linkage of sister axes by evenly-spaced “mini-axis” bridges (Chu et al., submitted). (G) 3D-SIM image of a nuclear complement of SCs with lateral elements are tagged by Pds5-GFP and (evenly-spaced) crossover recombination complexes tagged by HEI10-mCherry (De Muyt et al., 2014). (H-K) Mitotic chromosome axes and bridges visualized as in (F) (panel H) rendered in PyMOL along with corresponding axis intensity centroid paths of sister chromatids (Panel I). Red and blue indicate left- and right-handed helicity, respectively. (J) Centroid paths in (I) with bridge positions indicated as defined from (H). (K) Enlarged segment of an axis centroid path showing sequential half-helical segments of alternating handedness (perversions). (L) 3D time-lapse movie of TopIIa axes imaged and analyzed as in (H, I) (bridges not visible) showing dynamic fluctuations over < 15sec time-scale. (F, H-L are from (Chu et al., submitted)). (M, N) Muntjac (DM87) chromosomes labeled with Alexa555-dUTP in S-phase and imaged immediately after labeling (M) or, after segregation of a single chromosome, four generations later (N). Images taken with Nikon Ti widefield epi-fluorescence microscope and filtered using a Two-stage Likelihood Pipeline (N. Vincenten, F. Chang and N. Kleckner, unpublished).

