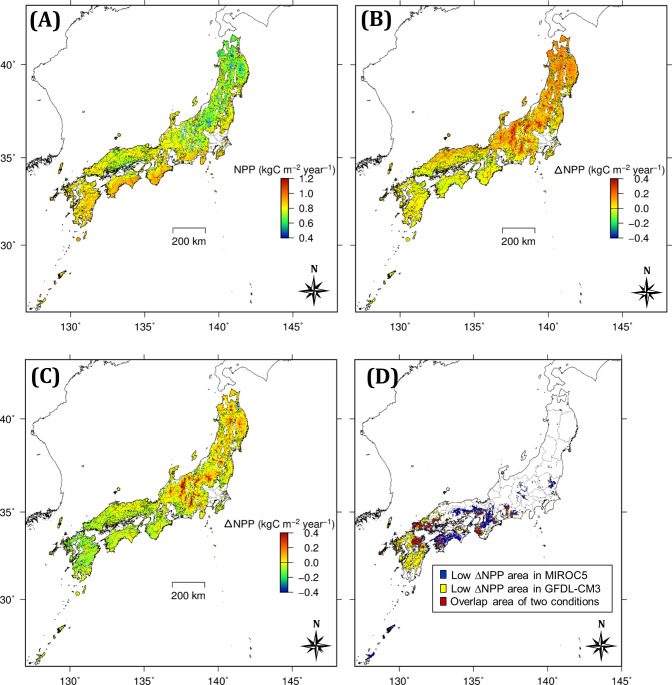
Fig 5. Estimated NPP and ΔNPP of Japanese cedar.
(A) NPP for H_2000 from MIROC5, (B) ΔNPP from H_2000 to F_2100 from MIROC5 under RCP2.6, (C) ΔNPP from H_2000 to F_2100 from GFDL-CM3 under RCP2.6, and (D) the NPP-decline area extracted from maps (B) and (C). The blue area of map (D) is based on ΔNPP < −0.02 kgC m-2 year-1 as indicated in map (B), the yellow area is based on ΔNPP < −0.075 kgC m-2 year-1 as indicated in map (C), and the red area indicates the overlap area of these two conditions.

