
Fig 7. Trends in ΔNPP according to five GCMs.
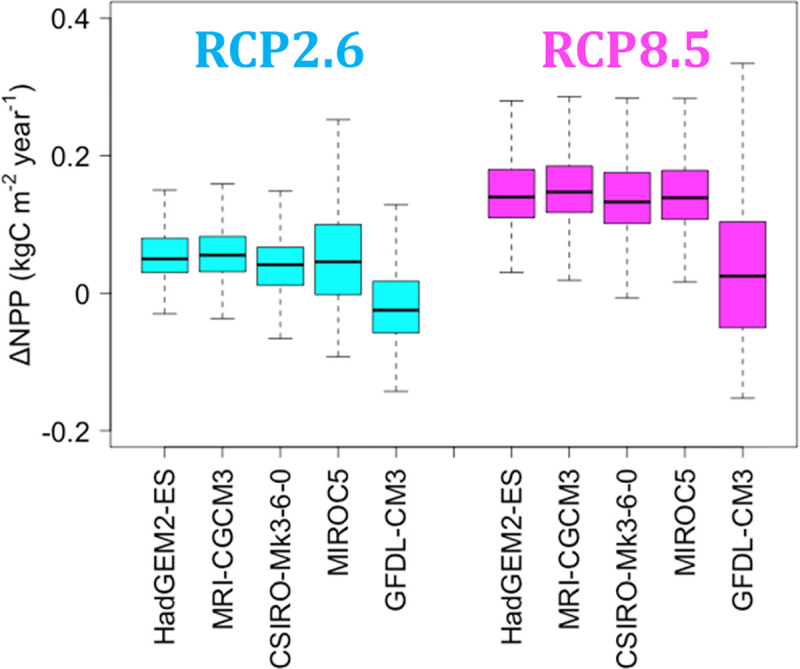
Comparison between H_2000 and F_2100. The outliers of ΔNPP are not shown in the figure, as the resulting wide ranges obscure the differences among GCMs.
Official websites use .gov
A
.gov website belongs to an official
government organization in the United States.
Secure .gov websites use HTTPS
A lock (
) or https:// means you've safely
connected to the .gov website. Share sensitive
information only on official, secure websites.
Comparison between H_2000 and F_2100. The outliers of ΔNPP are not shown in the figure, as the resulting wide ranges obscure the differences among GCMs.