
Fig 1. Dot-plots of R values for each condition (N, P, CR, RA and TSI) for the (A) EDI, (B) Abbott, (C) EuroImmun and (D) DiaSorin tests.
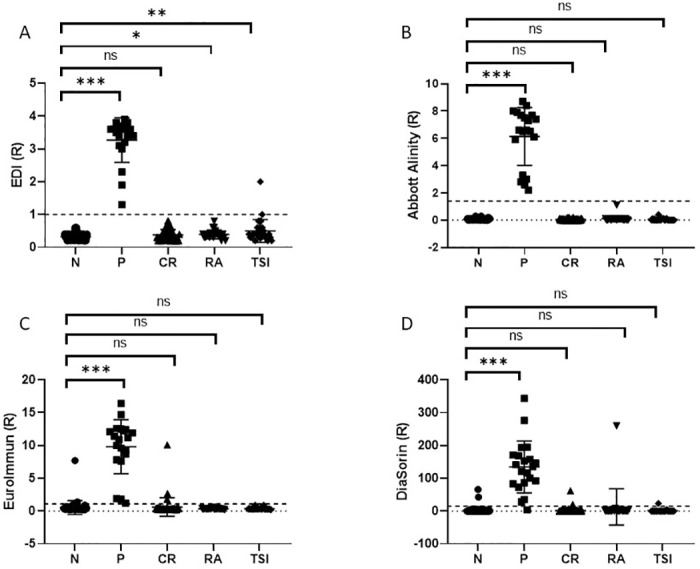
Mann-Whitney analysis demonstrated a significant increase in the R value for the positive samples. Mann-Whitney statistical significance *p<0.05; **p<0.01 and ***p<0.001. Dotted line represents the positive cut-off for each assay.