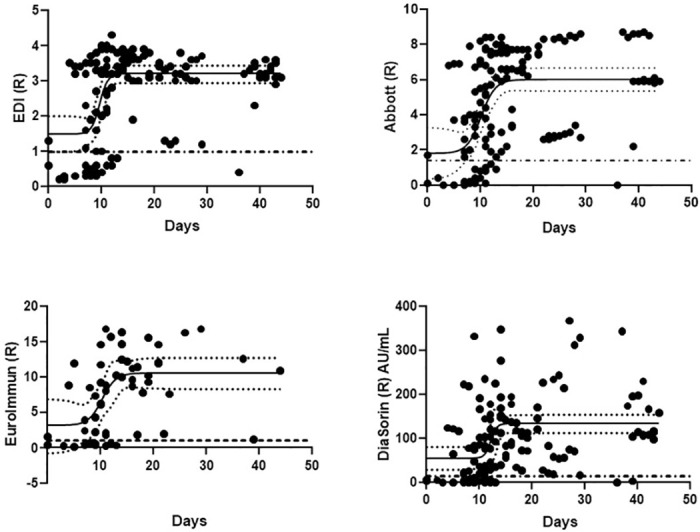
Fig 2. Seropositivity in specimen with PCR positive relative to day of PCR.

Dashed line represents the cut-off ratio for each assay. Solid black line and dotted lines represent the 4-parameter logistic curve-fit of the points with confidence interval. Time to PCR onset is calculated as curve inflection point.
