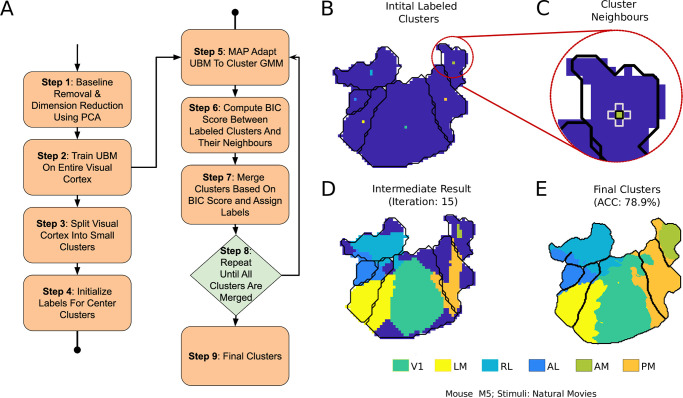
Fig 5. Pipeline for semi-supervised clustering of visual areas.
A) Block diagram of the clustering steps. B) Initial clusters that are labeled using the retinotopic map. C) Neighbors of a labeled cluster for area AM. BIC score is computed between these neighbors, and closest few are merged every iteration. D) An intermediate step in the clustering process. E) Final clustering result with accuracy (ACC).

