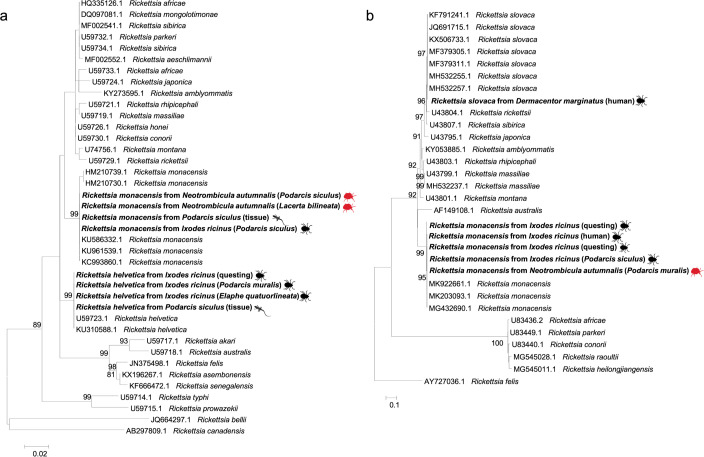
Fig 3.
Maximum-likelihood phylogenetic trees of gltA (A) and ompA (B) genes of Rickettsia spp. Bootstrap values (>70%) are shown near the nodes. Rickettsia belli, Rickettsia canadensis (A) and Rickettsia felis (B) were used as outgroups. Scale bar indicates nucleotide substitution per site. Rickettsia spp. sequenced in this study are in bold. Further details on the origin of samples are in brackets.

