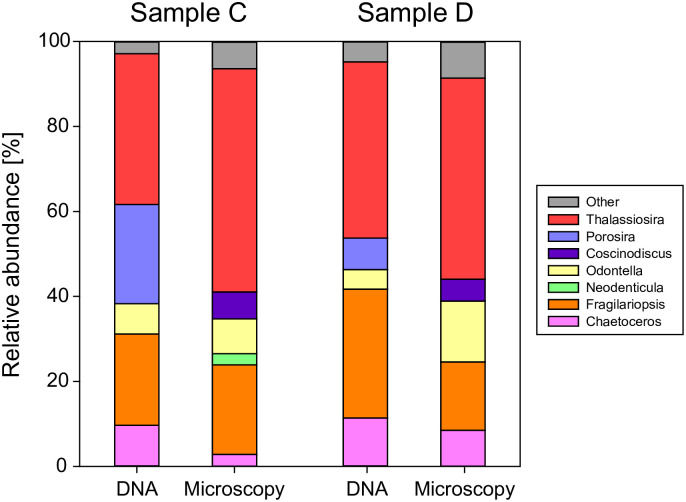
Fig 4. Comparison of DNA and microscopy analyses of diatoms at the genus level.
In the microscopy analysis, the relative abundance was calculated from the number of diatom cells. Only genera with more than 0.5% of total diatom reads or cell counts are shown. Porosira may be misidentified as Coscinodiscus in the microscopy analysis (see text).

