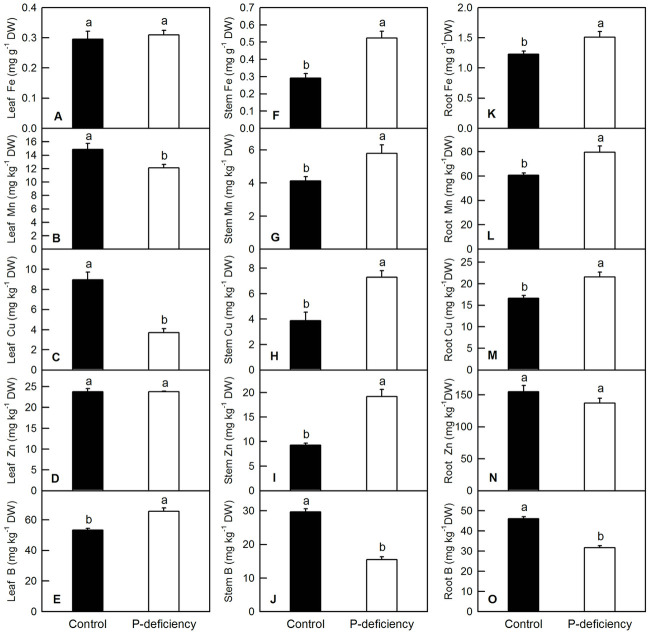
Fig 4. Effects of P deficiency on the contents of micronutrients in C. grandis leaves (A-E), stems (F-J) and roots (K-O).
Bars represent means ± SD (n = 3). Differences among the treatments were analyzed by Student’s t-test. Different letters above the bars indicate a significant difference at P < 0.05.

