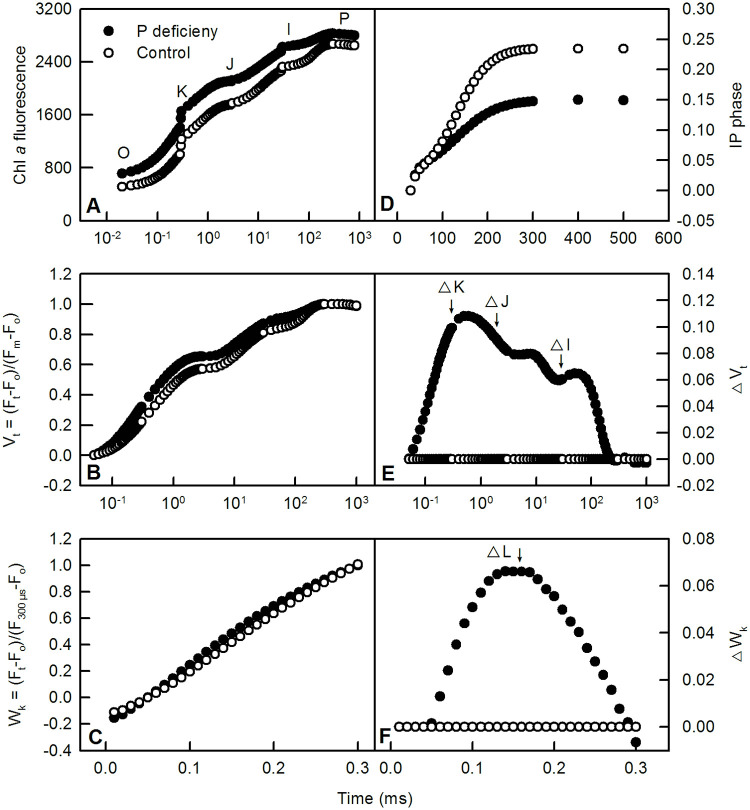
Fig 6. Effects of P deficiency on the average of Chl a fluorescence (OJIP) transients (A); relative variable fluorescence between Fo to Fm, Vt = (Ft-Fo)/(Fm-Fo) (B) and Fo to F300 μs, Wk = (Ft-Fo)/(F300μs-Fo) (C); IP phase from I-step to P-step, IP phase = (Ft-Fo)/(FI-Fo)-1 = (Ft-FI)/(FI-Fo) (D), and the difference in Vt (△Vt, E) and Wk (△Wk, F) between P-deficient samples and control samples treated with 200 μM P in dark adapted leaves.
Data are represented as the means of six replicates.

