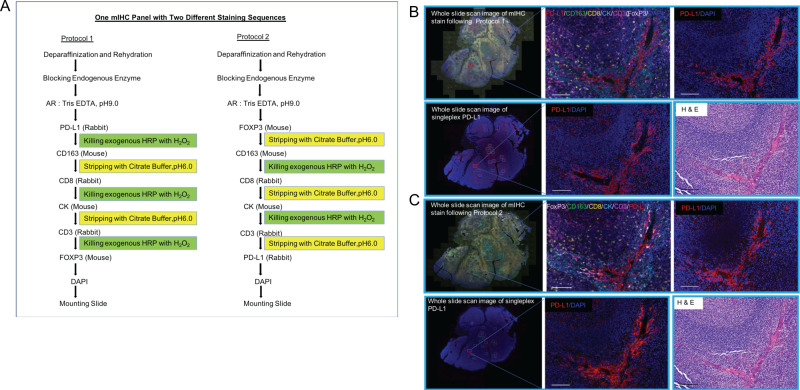
Fig 3. Comparison of staining sequences for mIHC.
Schematic diagrams show two protocols with different staining sequences (A). Multiplex IHC and single color images were obtained using these two protocols from human tonsil (FFPE) tissue serial sections. H&E images show the morphology (B, C). Singleplex IHC in adjacent slides verified individual biomarker stains in mIHC (B, C). The mIHC stain followed Protocol 1 in (B) and Protocol 2 in (C).

