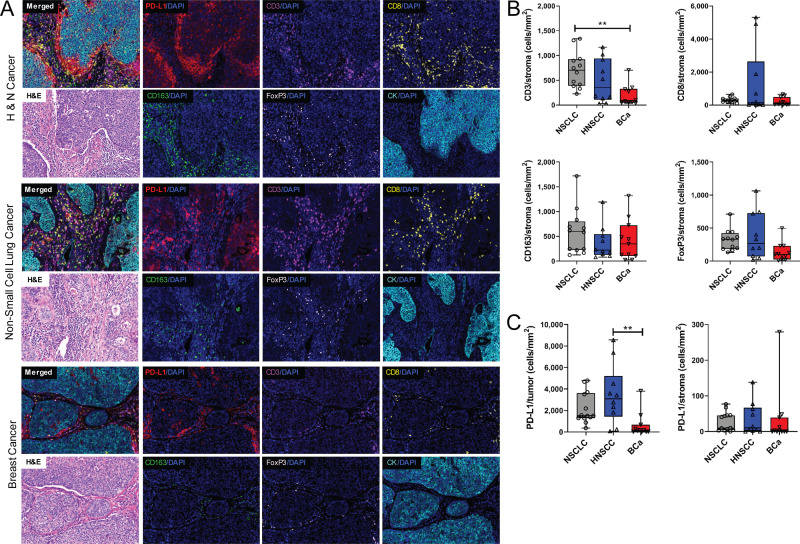
Fig 5. mIHC staining and analysis of immune infiltration of HNSCC, NSCLC, and BCa specimens.
The protocol was validated in head and neck cancer (HNSCC), non-small cell lung cancer (NSCLC), and breast cancer (BCa) patient samples. H&E images show the morphology (A). Different cell populations were compared among different cancer types including T cells (CD3+ or CD8+), Treg (FoxP3+), and PD-L1+ tumor cells. The median of each patient from all available ROI was used for analysis (B, C). Graphs depict the mean+/-range from all patients within each cohort. **P<0.01 (1-way ANOVA).

