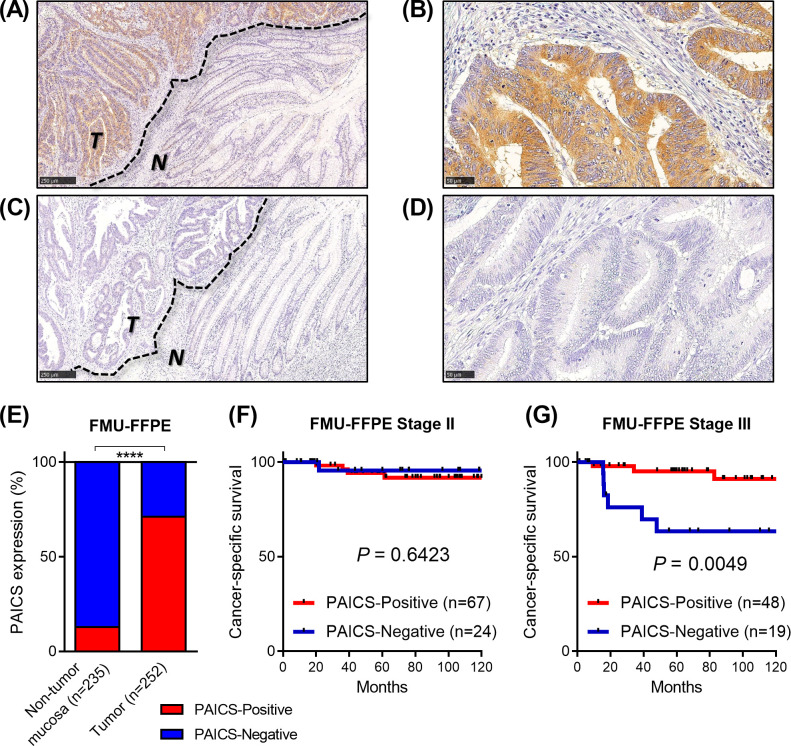
Fig 2. Immunohistochemistry for PAICS protein expression in resected colorectal cancer specimens in the FMU-FFPE cohort.
(A-B) Representative images for PAICS-Positive tumors. PAICS staining was strongly demonstrated in the cytoplasm of tumor cells, but not observed in adjacent non-neoplastic epithelial cells or stromal cells. (C-D) Representative images for PAICS-Negative tumors, showing loss of PAICS staining in tumor cells. T; tumor, N; adjacent non-tumor mucosa. Scale Bars, 250μm (A and C) or 50μm (B and D). (E) PAICS was overexpressed in the majority of tumors compared to adjacent mucosa, whereas 31.0% of tumors were found to be PAICS-Negative expression. ****P<0.0001. (F-G) Kaplan-Meier curves for cancer-specific survival according to the expression of PAICS by immunohistochemistry in stage II (F) and stage III (G) patients.

