
Fig 6. Auto-associative filtering methodology.
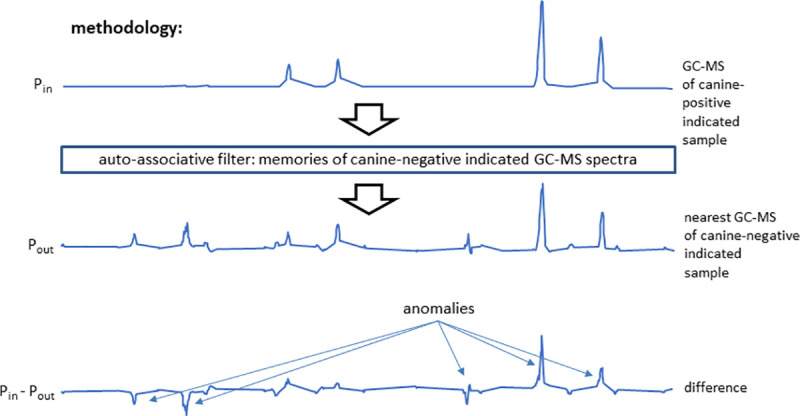
An auto-associative net was trained to reconstruct the GC-MS spectra of all the canine-negative indicated samples. Inputting the spectra of canine-positive indicated spectra, the net generated the nearest canine-negative indicated spectrum at its output. Subtraction of the output from the input spectrum revealed anomalous features possibly associated with the canine indication of cancer. In the example shown, both elute excesses (peaks) and deficiencies (troughs) are indicated in the difference spectrum. In short, this network acts as a database lookup table that supplies the closest matching canine-negative indicated spectrum to one that is applied, if need be producing synthetic data representing a potential canine-negative spectrum.