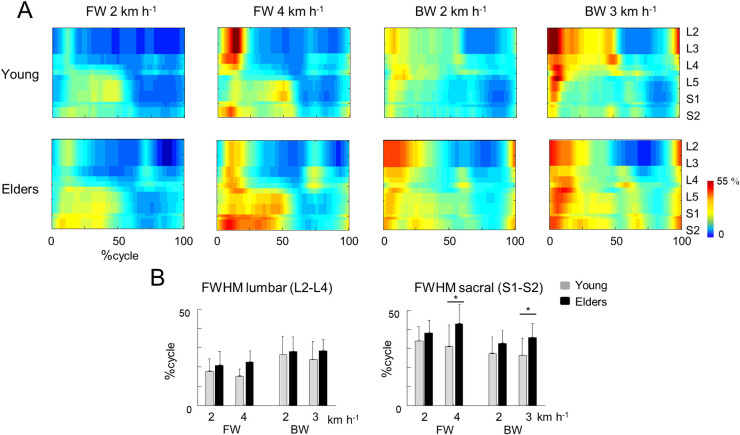
Fig 4.
Spatiotemporal spinal motor outputs computed from normalized EMGs (A) and average full width half maximum and mean activation of the lumbar (top) and sacral (bottom) segments (B) during forward and backward walking. For each individual, EMG signals from each muscle were normalized to unit variance across all trials [60]. The bars represent the grand mean of all the young (grey) and the older (black) adults. Thin lines represent one standard deviation. The * indicates a significant effect of age.

