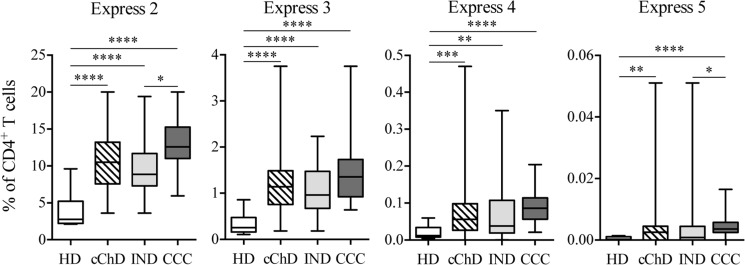
Fig 2. Frequency of the coexpression of inhibitory receptors in CD4+ T cells from chronic Chagas disease patients.
Analysis of the CD4+ T cells coexpressing any of the inhibitory receptors under study (2B4, CD160, CTLA-4, PD-1 and TIM-3) in chronic Chagas disease patients (cChD) [indeterminate (IND) and with cardiac symptomatology (CCC)] in comparison with that in healthy donors (HD). The size of the study population was 38 for cChD (25 IND and 13 CCC) and 12 for HD. The coexpression analyses of the five inhibitory receptors under study were carried out using a Boolean gates strategy using FlowJo 9.3.2 software. The box and whiskers of the graph represent all the values (from minimum to maximum). Statistical analyzes were performed using the Mann-Whitney U test. The p values shown by the asterisks are as follows: p<0.05 (*), p<0.01 (**), p<0.001 (***) and p<0.0001 (****).

