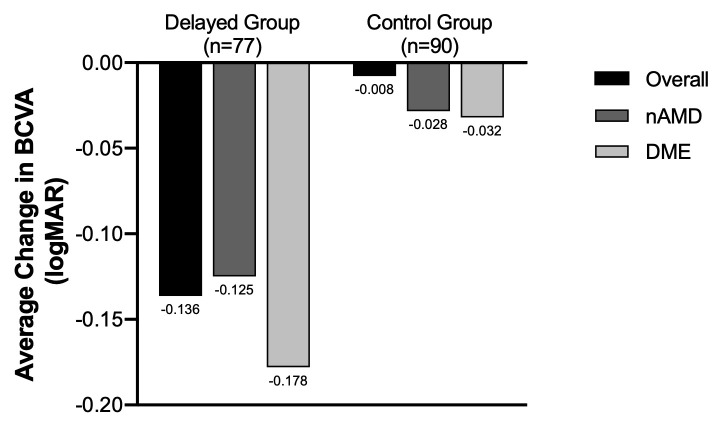
Fig 1. Delta BCVA (logMAR) (pre-COVID BCVA–follow-up BCVA) in the control and delayed groups.
BCVA worsened in the overall delayed group by an average of 0.136 and by an average of 0.008 in the overall control group (p = 0.02). This corresponds to a difference of approximately one line (or 5 letters). BCVA worsened in the delayed group with nAMD by an average of 0.125 and by an average of 0.028 in the control group with nAMD (p = 0.07). BCVA worsened in the delayed group with DME by an average of 0.178 and by an average of 0.032 in the control group with DME (p = 0.162).

