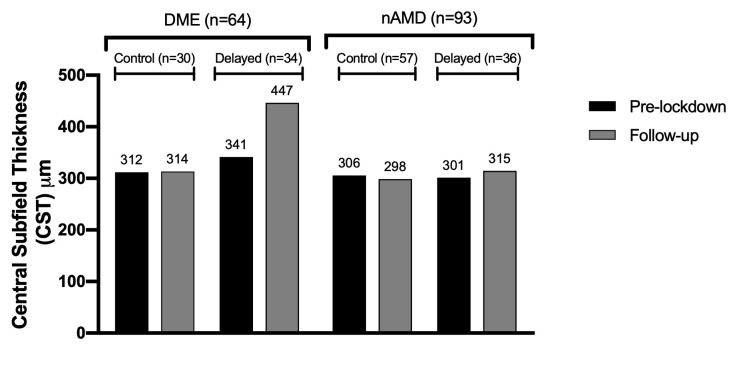
Fig 3. OCT analysis of patients with DME and nAMD at pre- and follow-up visits among control and delayed groups.
The most recent OCTs completed pre-lockdown was compared to the OCT at next subsequent follow-up. Central subfield thickness (CST) was measured. For patients with DME, a change in CST greater than 10% was noted per DRCR.net criteria for clinical significance. Among patients with DME, CST changed from 311 (pre-lockdown) to 314 (follow-up) (p = 0.9) in the control group and from 341 (pre-lockdown) to 447 (follow-up) (p = 0.03) in the delayed group. Among patients with nAMD, CST changed from 305 (pre-lockdown) to 298 (follow-up) in the control group (p = 0.4), and from 301 (pre-lockdown) to 314 (follow-up) in the delayed group (p = 0.4).

