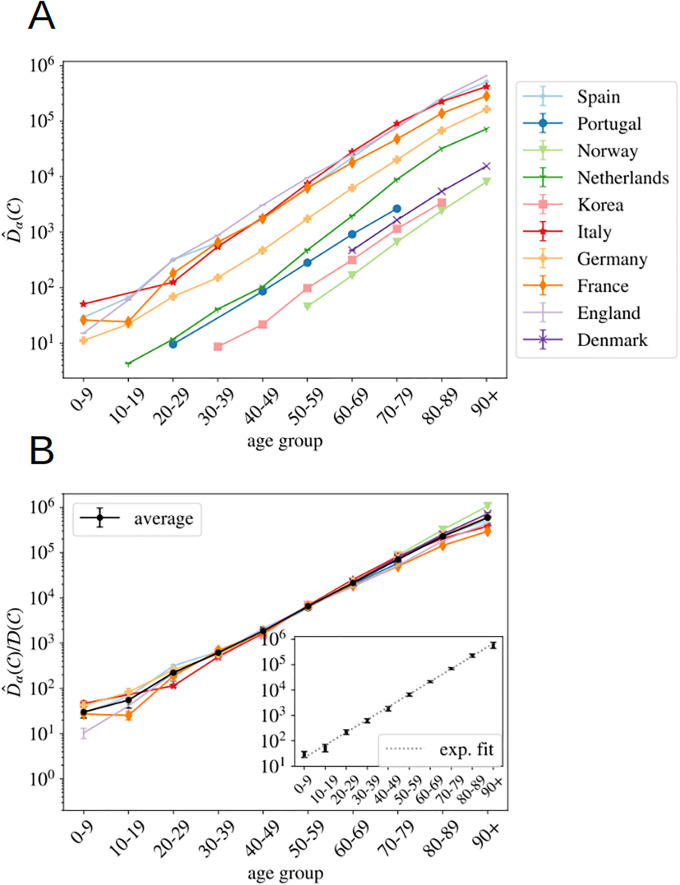
Fig 3. Normalized number of deaths in different countries as a function of age.
A We show the normalized number of deaths per age group (defined in Eq (2)) for a selection of countries affected by the COVID-19 epidemic at very different scales. In B, we show the same data (excluding the Netherlands) but where each country has been multiplied by a constant so that it collapses with the Spanish curve in the age region in between 30 and 70 years old. The values of each country’s constants are given in S2 Table. In black, we show the country average for each age segment (errors calculated with the boostrap method up to a 95% of confidence), and in C the fit of this average to a pure exponential function, see Eq (8).

