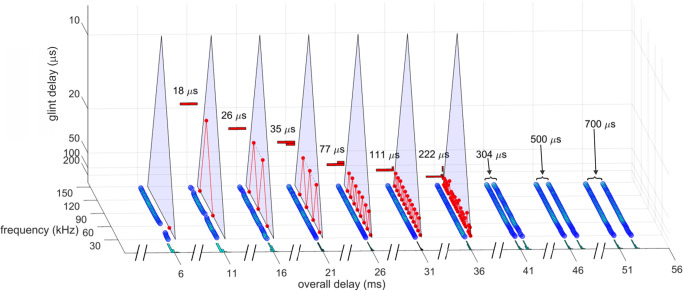
Fig 10. SCAT displays for two-glint click echoes.
The 3D SCAT plots of the whole series of two-glint click echoes from Fig 9 portray the range delay of each target on the horizontal X axis and the glint delay of each target on the X-Z plane. Using the display format defined in Fig 7, the dechirped spectrograms are plotted on the X-Y plane. For glint delays from 18 to 200 μs in Fig 9, the triangular network extracts the glint delay for each target from the apex points of the red zig-zag line on the triangular network. Combining the whole series of echoes into a batch for processing yields a graph of glint spacing on the X-Z plane. When the glint spacing reaches 300 μs, the two glint reflections pull apart in the spectrograms and no longer have an interference spectrum to be plotted on the triangular network or projected onto the back plane. Both glints then appear entirely on the horizontal overall delay axis.

