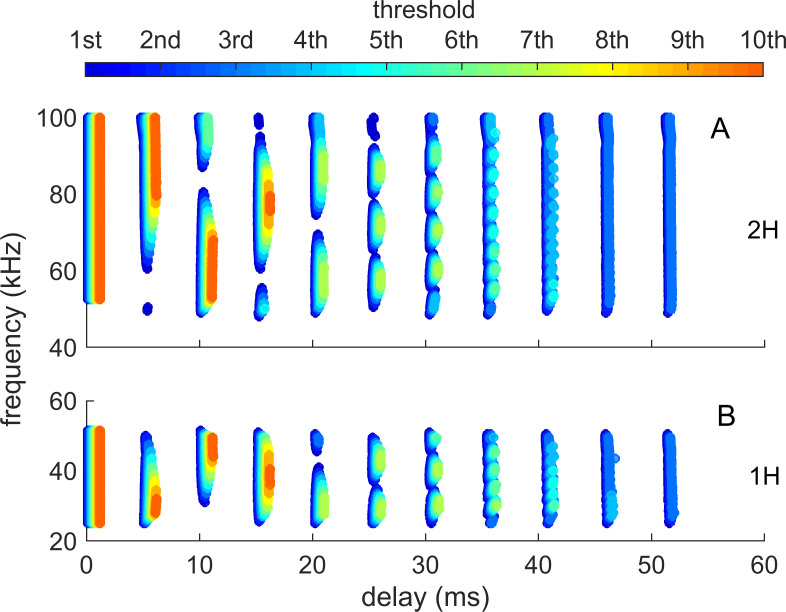
Fig 12. Dechirped SCAT spectrograms for two-glint FM echoes.
Dechirped spectrograms of FM echoes at all ten threshold levels (color bar in the top row) show the characteristic scalloped appearance due to the movement to longer latencies at higher thresholds (yellow to red) for frequencies of peaks and the restriction of threshold crossings to the lowest thresholds at the nulls (blue). FM1 and FM2 are plotted separately, with both harmonics in the broadcast at left. The threshold crossings for the broadcast follow vertical stripes, but the amplitude variations in the two-glint echoes break up the stripes into segments that appear as islands centered on the peaks (see also Fig 4C). The nulls are recognizable by the holes in the spectrograms.

