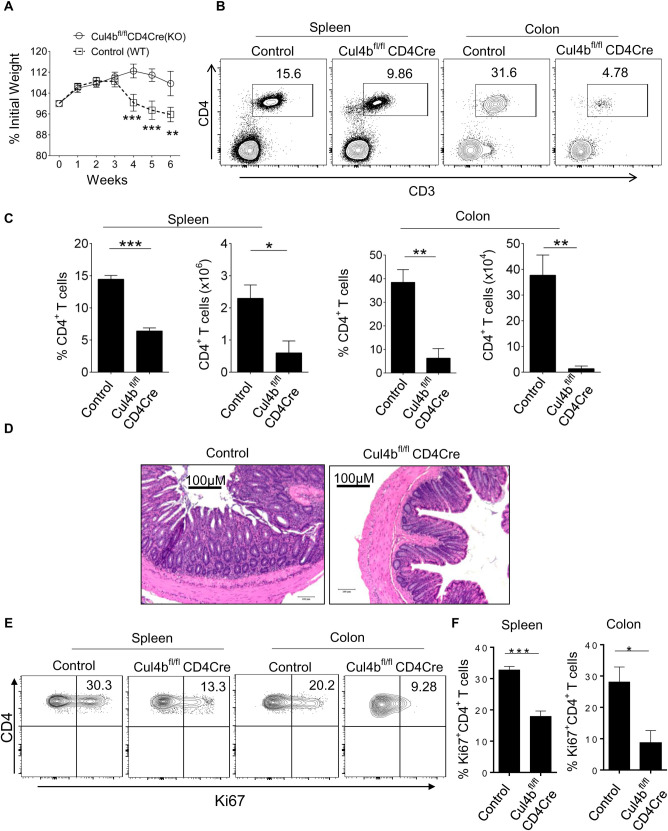
Fig 4. Cul4b regulates pathogenicity of CD4+ T cells.
Each Rag1−/− recipient mice was adoptively transferred with 1x10⁶ CD4+CD25−CD44−CD62Lhi naive T cells isolated from control and Cul4bfl/fl-CD4Cre mice. (A) The weight loss of the mice was monitored every 7 days for 6–7 weeks from the day after intraperitoneal injection. n = 5, recipient mice for each group were used and experiment was repeated twice. (B) The distribution of CD4+ T cell populations in the spleen and colon of Rag1−/− mice which received control (Cul4bfl/fl) and Cul4bfl/fl-CD4Cre CD4+ T cells was assessed by flow cytometry. (C) The bar graphs show the percentage and numbers of CD4+ T cells in the spleen and colon of Rag1−/− recipient. Data are represented as mean ± SEM and are representative of one of the 2 experiments (n = 5) (*P < 0.05 **P < 0.01, ***P < 0.001 by Student t test). (D) Representative H&E staining of colon sections from Rag1−/− mice transferred with control naive CD4+ T cells or Cul4bfl/fl-CD4Cre naïve CD4+ T cells, (magnification 10×, scale bar 100 μM). (E and F) CD4+ T cells in spleen and colon were analyzed for Ki67 expression. Representative plots show the frequencies of Ki67-positive cells in recipients that received control or Cul4bfl/fl-CD4Cre CD4+ T cells. The bar graphs show the relative frequencies of Ki67+CD4+ T cells in spleen and colon. (*P < 0.05, ***P < 0.001 by Student t test). For numerical raw data, please see S4 Data. Cul4b, Cullin-4b; SEM, standard error of mean.

