. 2021 Feb 17;191(1):39–43. doi: 10.1007/s11845-021-02548-9
© Royal Academy of Medicine in Ireland 2021, corrected publication 2021
This article is made available via the PMC Open Access Subset for unrestricted research re-use and secondary analysis in any form or by any means with acknowledgement of the original source. These permissions are granted for the duration of the World Health Organization (WHO) declaration of COVID-19 as a global pandemic.
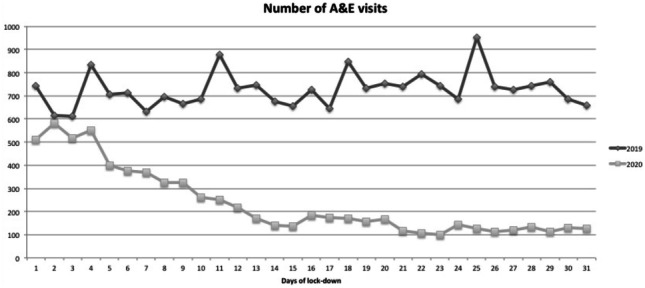
Fig. 1.

Daily distribution of the A&E visits in the same period of 2019 and 2020
