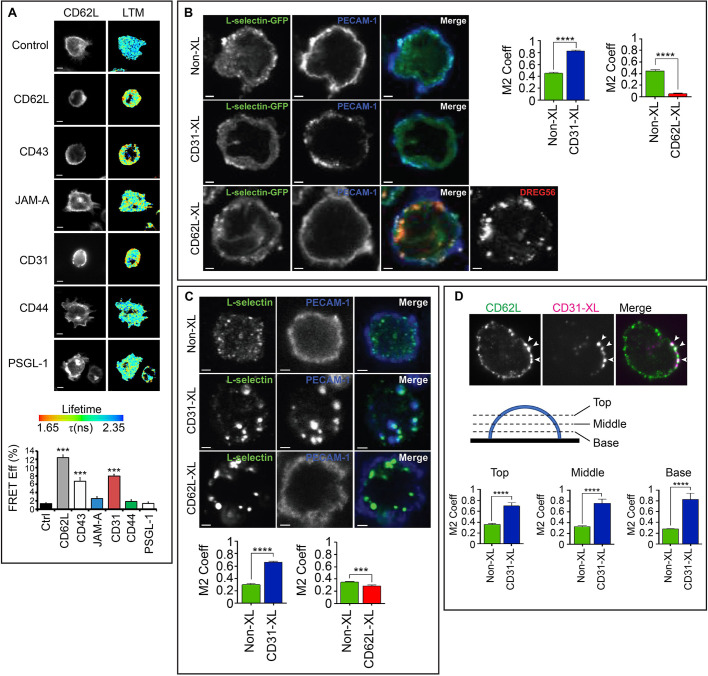
Fig. 1.
Antibody-mediated clustering of PECAM-1 drives inside-out clustering of L-selectin and its co-clustering with PECAM-1. (A) THP-1 cells expressing L-selectin–GFP and L-selectin–RFP were treated with a range of primary antibodies targeting L-selectin (CD62L), CD43, JAM-A, PECAM-1 (CD31), CD44 or PSGL-1. Primary antibodies were subsequently clustered with secondary antibody and cells plated onto poly-L-lysine (PLL), fixed in 4% PFA and prepared for FRET/FLIM analysis. GFP fluorescence channel and lifetime (LTM) images are provided for each cell line. The lifetime of fluorescence is expressed in a pseudocolour scale from red (low lifetime with a very high probability of interaction) to blue (high lifetime with a very low probability of interaction). Bar graph represents mean±s.e.m. acquired from at least 45 cells across three independent experiments. ***P<0.001 (one-way ANOVA followed by Tukey's post-test). Scale bars: 5 μm. (B) Confocal microscopy was used to monitor the effect of clustering either PECAM-1 (CD31-XL) or L-selectin–GFP (CD62L) on THP-1 cells. At least 200 cells were analysed. Manders’ overlap coefficient (M2 Coeff) was used to quantify (mean±s.e.m.) the extent of overlap between signals corresponding to CD31 and CD62L, represented in the column scatter graph. ****P<0.0001 (two-tailed unpaired Student's t-test with Welch's correction). Scale bars: 2.5 μm. (C) Primary human CD14-positive monocytes were purified from healthy donor bloods and clustering of either CD31 or CD62L were performed as described in B. M2 Coeff was used as a measure of colocalization (mean±s.e.m.) between signals corresponding to CD31 and CD62L, represented in the column scatter graph. At least 200 cells were analysed per treatment across at least three independent experiments. ***P<0.001, ****P<0.0001 (two-tailed unpaired Student's t-test with Welch's correction used). Scale bars: 2.5 μm. (D) iSIM was used to monitor the impact of clustering CD31 on the co-clustering behaviour of CD62L in primary human neutrophils. Cells were left untreated (Non-XL) or antibodies used to cluster CD31 (CD31-XL) as in B. Cells were plated onto poly-L-lysine and incubated at 37°C before fixation in 4% PFA. LAM1-14 monoclonal antibody was used to stain endogenous L-selectin, followed by donkey anti-mouse-IgG secondary antibody conjugated to Alexa Fluor® 488. A representative iSIM cross-sectional view of a neutrophil clustered with primary anti-CD31 antibody and secondary donkey anti-sheep antibody conjugated to Alexa Fluor® 633 is shown. Arrowheads highlight regions of L-selectin that are co-clustering with cross-linked PECAM-1. Three different optical sections were taken, as depicted in the diagram, and Manders' overlap co-efficient (M2 Coeff) was used to quantify the extent of overlap between the two signals. Mean±s.e.m. are derived from 38 cells for each treatment across three independent experiments. ****P<0.0001 (two-tailed unpaired Student's t-test with Welch's correction). Images shown are 13.2×13.2 μm (E) Flow cytometric analysis of primary human neutrophils treated with the anti-PECAM-1 monoclonal antibody HEC7. Neutrophils were treated with HEC7 alone (grey line) or HEC7 plus a secondary clustering antibody conjugated to Alexa Fluor® 647 (green line). DREG56 directly conjugated to phycoerythrin (PE) was used to monitor L-selectin expression in untreated cells (black line), and cells with HEC7 alone (grey line) or with HEC7 plus clustering secondary antibody (green line). Purple line represents unstained neutrophils. Histogram is representative of three independent experiments (see Figs S1 and S2).

