
Fig. 6. Rho-GTPases and MMPs jointly drive matrix remodeling and invasion.
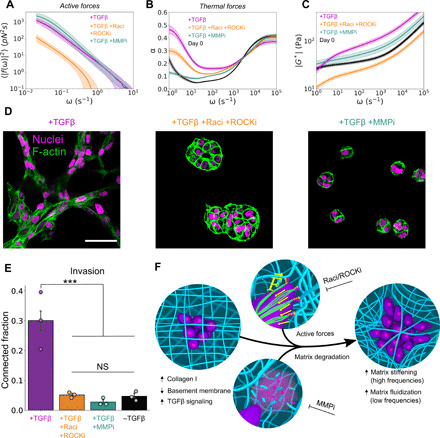
(A) Effect of 6 days of either simultaneous Rac1 and ROCK inhibition (+Raci +ROCKi) or MMP inhibition (+MMPi) on the active force fluctuation spectrum of TGFβ-treated MCF10AT spheroids in col/rBM. (B) Viscoelastic power-law scaling exponent, α, in different drug treatment groups. (C) Magnitude of the shear modulus ∣G*∣ as a function of frequency ω. (D) Confocal microscopy of TGFβ and drug-treated spheroids in col/rBM (day 6). F-actin fibers (green false color) were stained with TRITC-phalloidin. Nuclei were visualized using endogenously expressed H2B-GFP. Scale bar, 50 μm. (E) Quantification of 3D invasion, as measured by spheroid connectivity (one-tailed t test with Benjamini and Hochberg false discovery rate multiple comparisons correction. ***P < 0.001; NS, not significant). (F) Summary schematic of cell-mediated remodeling of the ECM. In (A) to (C), curves and bands represent the arithmetic mean and 68% confidence interval of the mean, respectively, among biological replicates (n = 5 for no drug and for MMPi cultures and n = 8 for Raci/ROCKi cultures). In (E), bars represent the arithmetic mean among independent imaging wells (nine fields of view per well). Error bars represent 68% confidence intervals of the means (n = 3). Each data point represents the average of one well.