
Fig. 3. Deep mutagenesis reveals that the ACE2-binding site of SARS-CoV-2 tolerates many mutations.
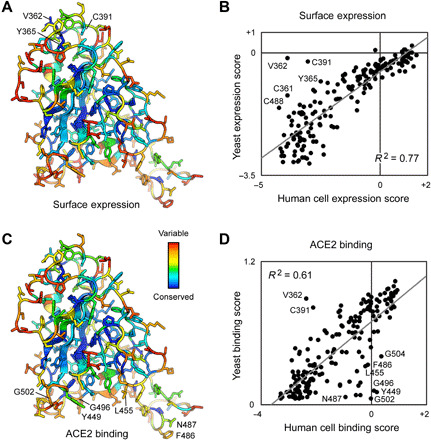
(A) Positional scores for surface expression are mapped to the structure of the SARS-CoV-2 RBD (PDB: 6M17, oriented as in Fig. 1). Blue residues in the protein core are highly conserved in the FACS selection for surface S expression (judged by depletion of mutations from the ACE2-high and ACE2-low gates), while surface residues in red tolerate mutations. (B) Correlation plot of expression scores from mutant selection in human cells of full-length S (x axis) versus the conservation scores (mean of the log2 enrichment ratios at a residue position) from mutant selection in the isolated RBD by yeast display (y axis). Notable outliers are indicated. (C) Conservation scores from the ACE2-high gated cell population are mapped to the RBD structure, with residues colored from low (blue) to high (red) mutational tolerance. (D) Correlation plot of RBD conservation scores for high ACE2 binding from deep mutagenesis of S in human cells (x axis) versus deep mutagenesis of the RBD on the yeast surface (mean of ΔKD app; y axis).