
Fig. 3. Characterization of the separated single-chirality species.
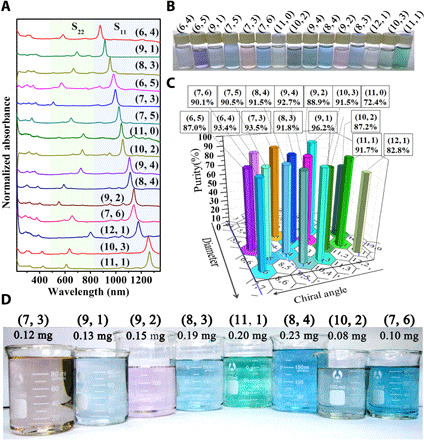
(A) Optical absorption spectra of 15 types of single-chirality species separated by the temperature control technique. (B) Photographs of the separated single-chirality SWCNTs. (C) Purity distribution of various single-chirality (n, m) species. (D) Solution photographs of the submilligram-scale single-chirality near-zigzag species. The mass of each (n, m) SWCNT was calculated on the basis of its optical absorbance at 280 nm (60). Photo credit: Dehua Yang, Institute of Physics, Chinese Academy of Sciences.