
Fig. 1. Ventral midbrain patterning defects in DNAJC6 mutant human midbrain-like organoids.
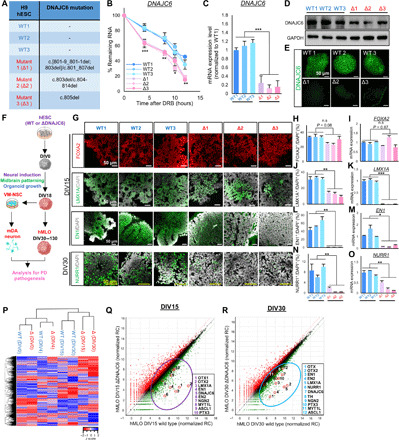
(A) Summary of mutated gene sequences in the DNAJC6 mutant hESCs (Δ1, 2, 3) generated in our study. (B) DNAJC6 mRNA stability in the WT and mutant hESCs. DRB, 5,6-dichloro-1-beta-d-ribofuranosylbenzimidazole, a mRNA transcription inhibitor. (C to E) mRNA and protein expressions of DNAJC6 estimated by quantitative polymerase chain reaction (qPCR) (C), Western blot (WB) (D), and immunocytochemical (E) analyses. Scale bars, 50 μm. (F) Schematic of hESCs differentiated to hMLOs, two-dimensional VM neural stem/precursor cells (NSCs), and mDA neuron cultures, used as an experimental platform. (G to O) Expression of the early (FOXA2, LMX1A, and EN1) and late (NURR1) midbrain-specific markers. The early and late midbrain marker expressions were determined in the WT and mutant hMLOs at DIV15 and DIV30, respectively, using immunocytochemical (G, H, J, L, and N) and qPCR (I, K, M, and O) analyses. For quantification of the marker-positive cells, five hMLOs from five different batches from each WT and mutant cultures were cryosectioned at 16-μm thickness, and the positive cells were counted every five sections from each hMLO. Scale bars, 50 μm. (P to R) RNA sequencing (RNA-seq) analysis for WT versus mutant hMLO cultures at DIV0, DIV4, DIV15, and DIV30. (P) Unsupervised hierarchical clustering for the differentially expressed genes (DEGs) between the WT and mutant hMLOs [fragments per kilobase of transcript per million mapped reads (FPKM) >1, fold change >2]. (Q and R) Scatterplots of the DEGs highlighting mDA neuron developmental genes are included in the most significantly and greatly up-regulated in the WT hMLOs versus mutant hMLOs at DIV15 and DIV30. Data are presented as means ± SEM, n = 3 independent experiments. Significance at *P < 0.05; **P < 0.01; ***P < 0.001, Student’s t test; n.s., no significance.