
Fig. 2. Loss of DNAJC6-mediated CME causes defects in WNT intracellular signaling at early stages of DNAJC6 mutant hMLOs.
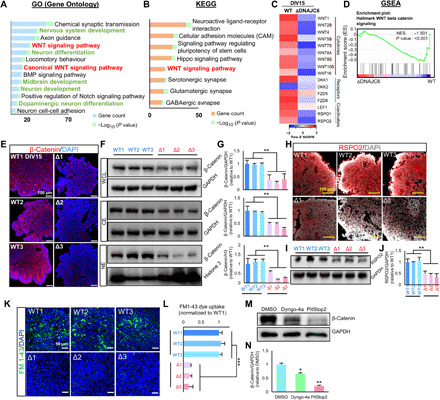
(A and B) Top GO and KEGG pathways for the genes down-regulated in mutant hMLOs (versus WT hMLOs) at DIV15. “WNT signaling pathway” is highlighted in red. “mDA development”–related categories are highlighted in green. (C) Heatmap for the expressions of WNT cytokines, receptors, and coactivators in the RNA-seq data. Expression values are shown as log2-transformed normalized read counts. (D) Gene set enrichment analysis (GSEA) showed enrichment of WNT signaling in WT cells compared with mutant DNAJC6. (E to G) Immunocytochemical (E) and WB analyses (F) to determine β-catenin protein levels in the WT and mutant hMLOs at DIV15. Intensities of the bands in (F) were quantified using ImageJ software, and the values were normalized to glyceraldehyde-3-phosphate dehydrogenase (GAPDH) (G). WCL, whole-cell lysate; CE, cytosolic extract; NE, nuclear extract. Scale bars, 100 μm. (H to J) Immunocytochemical (H) and WB analyses (I) to determine R-spondin 2 protein levels in the WT and mutant hMLOs at DIV15. Intensities of the bands in (I) were quantified using ImageJ software, and the values were normalized to GAPDH (J). (K and L) Endocytic capacity assessed by the uptake of FM1-43 dye (K). Fluorescence intensity of FM1-43 was measured using ImageJ in 30 cells randomly chosen from each WT and mutant NSC cultures (L). Scale bars, 50 μm. (M and N) Decrease of β-catenin protein levels by treatment of the clathrin-mediated endocytosis inhibitor (M). The WB analysis was done in the VM-NSC cultures derived from WT1-hMLOs. Intensities of the bands in (M) were quantified using ImageJ software, and the values were normalized to GAPDH (N). Data are presented as means ± SEM. n = 3 independent experiments. DMSO, dimethyl sulfoxide. Significance at *P < 0.05; **P < 0.01; ***P < 0.001, Student’s t test (G, J, and L) and two-way analysis of variance (ANOVA) followed by Bonferroni’s post hoc test (N).