
Fig. 5. Mitochondrial dysfunction in DNAJC6 mutants.
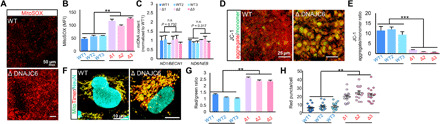
(A and B) Mitochondrial ROS in differentiated NSC culture were detected using MitoSOX Red probes (A). Fluorescence intensity was measured using ImageJ in 15 different areas from three independent experiments (B). ROS levels are presented as mean fluorescence intensity. Scale bars, 50 μm. (C) qRT-PCR analysis of mitochondrial DNA ratio in WT and mutant neurons, (n = 3). (D and E) Mitochondrial membrane potential analysis with JC-1 in differentiated NSC culture (D). A decrease in the red fluorescence (JC-1 aggregate)/green fluorescence (JC-1 monomer) ratio indicates depolarization/disruption of the mitochondrial membrane potential (E). Scale bars, 25 μm. (F to H) Representative images of MitoTimer reporter gene expression in differentiated NSC cultures (F). Red fluorescence represents oxidized Ds-Red mutant (DsRed1-E5) caused by oxidative stress. Mitochondria damage was measured as the red:green ratio (G) and number of pure red puncta per cell. n = 15 cells from each group (H). Scale bar, 10 μm. Data are presented as means ± SEM, n = 3 independent experiments. Significance at **P < 0.01; ***P < 0.001, Student’s t test.