
Fig. 6. Autolysosomal dysfunctions in DNAJC6 mutant neuron.
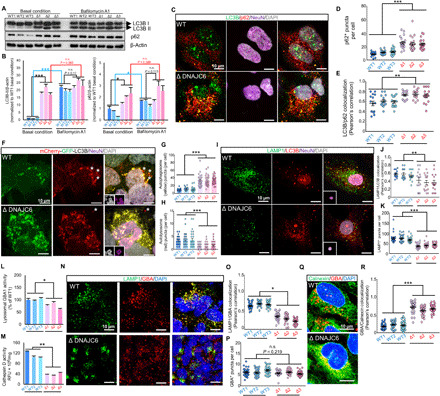
(A and B) WB analysis of the autophagosome components LC3BII and p62 in the presence or absence of bafilomycin A1. (B) represents the protein levels of LC3BII and p62 (normalized to β-actin) relative to the WT1 value at basal condition. n = 3 independent experiments. (C to E). Representative image of LC3B/p62 staining in differentiated neuron cultures (C). Scale bars, 10 μm for all images. Quantification of p62+ puncta number per cell (D) and colocalization of p62+ and LC3+ puncta per cell (E). n = 12 cells (D) and n = 15 cells (E) from each group. (F to H) Representative image of differentiated neuron expressing mCherry-GFP-LC3B (F). Insets, DAPI+ (gray) and NeuN+ (purple) images in the same microscopic fields. Quantification of autophagosomes (yellow puncta) and autolysosomes (red puncta) number per cell (G and H). n = 30 cells. Asterisk (*) symbols indicate autolysosomes. (I to K) Representative image of LAMP1/LC3B staining in differentiated neurons (I). Inset, DAPI+/NeuN+ image. Colocalized LAMP1+ with LC3+ puncta per cell (J). LAMP1+ puncta per cell (K). n = 15 (J) and n = 30 (K) cells. (L and M) Lysosomal glucocerebrosidase 1 (GBA1) (L) and cathepsin (M) activities. n = 3 biological replicates. (N to P) Representative LAMP1+/GBA+ images in differentiated neuron (N). The numbers of colocalized LAMP1+/GBA+ puncta (O) and GBA+ puncta (P) per cell were quantified. n = 24 (O) and n = 20 (P) cells. (Q and R) Representative calnexin+/GBA+ images (Q). The numbers of colocalized calnexin+/GBA+ puncta per cell (R). n = 30 cells. Data are presented as means ± SEM. Significance at *P < 0.05; **P < 0.01; ***P < 0.001, Student’s t test.