
Fig. 7. DNAJC6 does not require LMX1A in preventing lysosomal dysfunction.
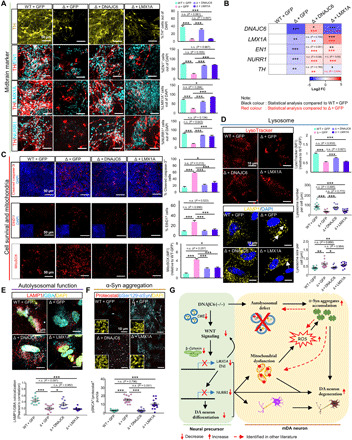
DNAJC6 mutant (△3) NSCs were transduced with the lentiviruses expressing LMX1A, DNAJC6, or GFP (control) and then differentiated into mDA neurons. (A and B) Expression of midbrain-specific factor was determined in the differentiated mDA neuronal cultures using immunocytochemical (A) and qPCR (B) analyses. Scale bars, 50 μm. n = 3 independent experiments. (C) Cell viability assessed by the number of cleaved caspase-3+ and EthD1+ cells (first and second rows) and mitochondrial ROS estimated by MitoSox (third row). Scale bars, 50 μm. n = 3 independent experiments. (D) LMX1A and DNAJC6 rescuing effects on amount and size of lysosome. Confocal microscopy for LysoTracker Red DND99 in differentiated neurons. Scale bars, 10 μm. Averages of mean LysoTracker fluorescence intensities per cell are quantified in the graph at the first row. n = 15 cells from each group. Visualization of lysosome by LAMP1 staining in differentiated neurons. Scale bars, 10 μm. Quantification of lysosome number per cell (second graph) and lysosome size per cell (third graph), n = 15 cells from each group. Each dot represents the average value of lysosome size per cell. The white arrow indicates an enlarged lysosome. (E) Representative image of LAMP1/GBA staining in differentiated neurons. Scale bars, 50 μm. Quantification of colocalized LAMP1+ and GBA+ puncta per cell. n = 15 cells from each group. (F) LMX1A and DNAJC6 rescuing effects on α-syn aggregation in differentiated neuron. The α-syn aggregation was quantified by the number of pSer129-αSyn+/ProteoStat+ puncta per cell. Scale bars, 10 μm. n = 15 cells from each group. (G) Schematic summary for PD pathogenic signaling pathways caused by loss of DNAJC6. Data are presented as means ± SEM. Significance at *P < 0.05; **P < 0.01; ***P < 0.001, one-way ANOVA with Bonferroni post hoc analysis.