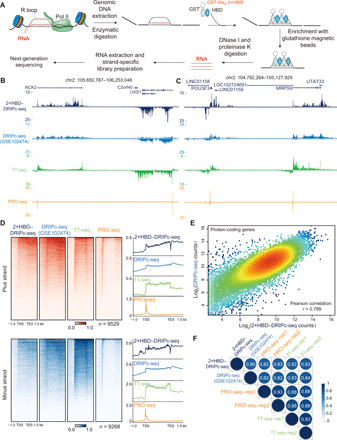
Fig. 2. Well-correlated profiles of GST-His6-2×HBD and S9.6 in DRIPc-seq–based R loop analysis.

(A) Schematic presentation of DRIPc-seq with GST-His6-2×HBD protein. (B and C) UCSC genome browser tracks of 2×HBD-DRIPc-seq, DRIPc-seq (GSE102474) (34), PRO-seq, and TT-seq reads density at the NCK2, UXS1 (B), MRPS9, and POU3F3 (C) loci. Read density was normalized by reads per million (r.p.m.). (D) Heatmap and metagene plots of 2×HBD-DRIPc-seq, the published DRIPc-seq, PRO-seq, and TT-seq signals in the plus and minus strands. (E) Scatter plot of the 2×HBD-DRIPc-seq counts and S9.6–DRIPc-seq counts with all of the protein-coding genes. The Pearson correlation coefficient is shown. (F) The genome-wide Pearson correlation heatmap of 2×HBD-DRIPc-seq, S9.6-DRIPc-seq, and TT-seq showing densities within all protein-coding genes.
