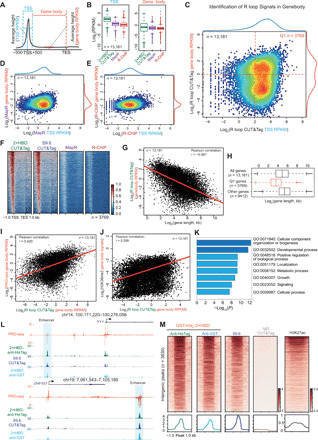
Fig. 7. R loop CUT&Tag sensitively detects signals at gene body and intergenic regions.

(A) Scheme of calculation of signals at TSS and gene body. The signals were normalized by RPKM. (B) Box plots of RPKM values at the TSS and gene body from 13,181 transcriptional active genes. (C) Scatter plot of R loop CUT&Tag signals at the TSS and gene body showing that R loop CUT&Tag is capable of genome wide detecting the R loop in the gene body. (D and E) Scatter plots of MapR (D) and R-ChIP (E) RPKM signals at the TSS and gene body. (F) Heatmap plots of the 3769 genes with R loop signals at gene body (G and H) The R loop signals at gene body were negatively correlated with gene lengths. (I and J) The gene body R loop signals positively correlate with PRO-seq (I) and H3K36me3 (J) signals at the gene body. (K) Gene ontology (GO) analysis of the 3769 genes indicates that R loop may be involved in the regulation of various key biological processes. (L) Track examples of HEK293T PRO-seq, GST-His6-2×HBD CUT&Tag, and S9.6 CUT&Tag signals at the YY1 and ZNF557 genomic loci. The reads were normalized by reads per million, and the enhancers are indicated. (M) Heatmap analysis of R loop CUT&Tag signals at 3830 intergenic regions. The heatmaps were sorted by the GST-His6-2×HBD CUT&Tag signals, and the H3K27ac signals in HEK293T are shown. H3K27ac, histone 3 lysine 27 acetylation.
