
Fig. 1. Experimental setup and convection pattern.
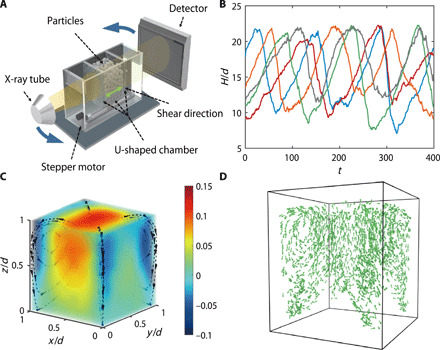
(A) Experimental setup. (B) Tracers’ height trajectories as a function of shear cycle number t. (C) Flow pattern of convection. (D) Flow pattern of tracer particles (D = 12-mm) at steady state.
Official websites use .gov
A
.gov website belongs to an official
government organization in the United States.
Secure .gov websites use HTTPS
A lock (
) or https:// means you've safely
connected to the .gov website. Share sensitive
information only on official, secure websites.
(A) Experimental setup. (B) Tracers’ height trajectories as a function of shear cycle number t. (C) Flow pattern of convection. (D) Flow pattern of tracer particles (D = 12-mm) at steady state.