
Fig. 2. Snapshots of different tracer particles at their respective steady states.
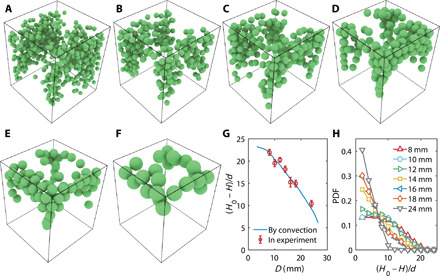
(A to F) Snapshots of particle positions of (A) 8-, (B) 10-, (C) 12-, (D) 14-, (E) 16-, and (F) 24-mm tracers at steady states. (G) Maximal penetration depth of tracer particles. The maximal depth that different-size tracers can reach calculated by convection flux analysis (blue line) and the experimentally observed results, which are averaged among hundreds of tracer particles for consecutive 1500 shear cycles (red symbols). (H) Probability distribution functions (PDF) of tracer particles as a function of depth at steady states.