
Fig. 3. Height trajectories and segregation speeds of tracer particles.
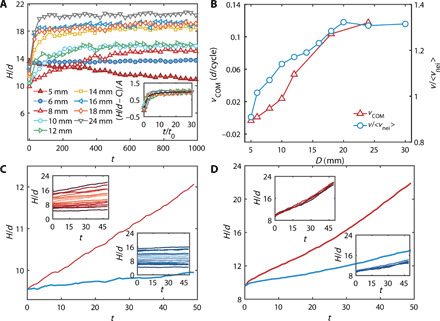
(A) Heights of the COMs for different-size particles as a function of shear cycle number t. Inset: All curves can be fitted by H/d = A exp(− t0/t) + C, where t0 is the intrinsic time scale of different-size particles to reach the steady states. All curves can collapse after rescaling with t0. (B) Average speeds of the COMs vCOM (red, left axis) and the average normalized speeds v/〈vnei〉 (blue, right axis) for different-size particles. (C and D) Height trajectories of 16 D = 12-mm and 4 D = 24-mm tracer particles as a function of shear cycle number t. The top and bottom insets show the absolute (red) and relative (blue) height trajectories of the tracer particles before and after subtraction of the neighboring particles’ vertical displacements.