
Fig. 4. Up-down asymmetry of Z and ϕ around the tracer particles, global density gradient, and the pair correlation function of tracer particles.
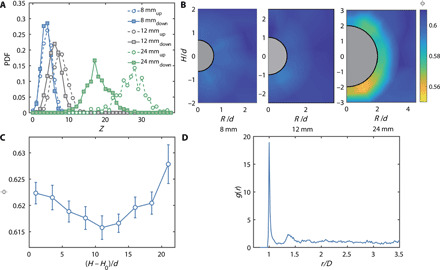
(A) PDF of contact number in the upper and lower hemispheres for 8-, 12-, and 24-mm tracers. (B) Average volume fraction distribution of background particles within 4d distance to 8-, 12-, and 24-mm tracers that show the up-down asymmetry. (C) Average volume fraction ϕ of the system as a function of depth. (D) Pair correlation function between 200 12-mm tracers.