
Fig. 5. Arching effect and fluidization around tracers within one cycle.
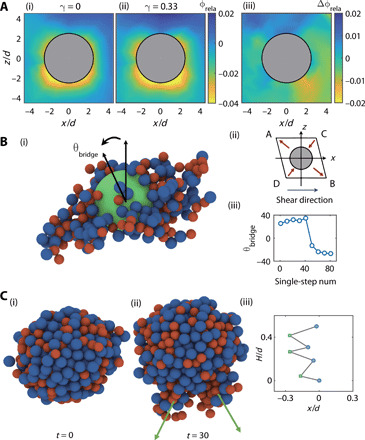
(A) (i and ii) Relative volume fraction ϕrela around the tracer at γ = 0 and γ = 0.33. (iii) Variation of ϕrela around the tracer Δϕrela = ϕrela, γ = 0.33 − ϕrela, γ = 0 between γ = 0.33 and γ = 0 during the first one-fourth shear cycle. (B) (i) Complex bridge structure containing the tracer when the system is sheared rightward. The orientation of the complex bridge structure is defined as the orientation of the principal axis of its inertia tensor with the maximum eigenvalue. θbridge is the angle between the orientation of the bridge structure and z axis on the xz plane. (ii) Schematic diagram of rightward shear. (iii) Evolution of θbridge during the first half shear cycle. When shear is reversed, θbridge changes its direction from BD (θbridge > 0) to AC (θbridge < 0). (C) (i) Background particles around the tracer at the initial state (5- and 6-mm particles are colored by red and blue). (ii) Same particles as the left panel after 30 shear cycles. The green arrows represent the preferred directions that particles flow relative to the tracer. (iii) Trajectory of the tracer particle acquired at the interval of half shear cycle. The zigzag shape demonstrates the asymmetric arch effect due to shear.