
Fig. 1. ISWI knockdown results in sleep deficits in adult Drosophila.
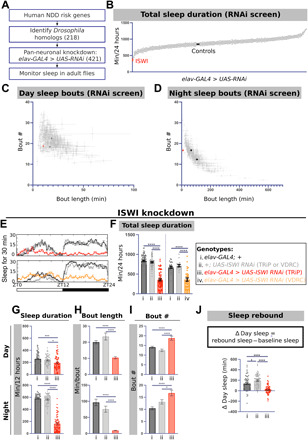
(A) Design of NDD risk gene sleep screen. (B) Total sleep in all viable screened RNAi lines (348 lines, n ≥ 16 per RNAi line). Average sleep bout length and sleep bout number plotted for all lines across the (C) day and (D) night. (E) Representative sleep traces of genetic controls (black and gray) and pan-neuronal ISWI knockdown with two independent RNAi lines (red and orange). (F) Total sleep duration, (G) day and night sleep duration, (H) sleep bout length, and (I) sleep bout number in ISWI knockdown compared to genetic controls [n = 70, 61, 68, 24, 16, and 31 for groups from left to right in (F)]. (J) Rebound sleep in ISWI knockdown (red) and genetic controls (gray) (n = 63, 65, and 61 from left to right). For graphs in this figure and all other graphs, unless otherwise stated, data are presented as means ± SEM. *P < 0.01, **P < 0.01, ***P < 0.001, and ****P < 0.0001 and analyzed with one-way analysis of variance (ANOVA) with post hoc Tukey’s multiple comparison test (B and F to J).