
Fig. 5. ISWI knockdown in type I neuroblasts leads to sleep disruption and MB morphologic deficits.
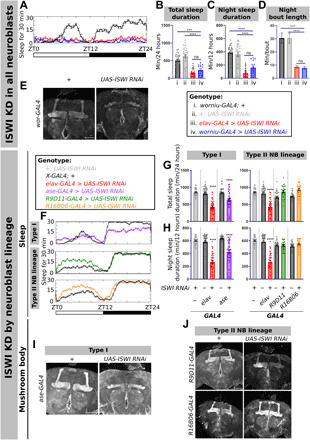
(A) Representative sleep traces from multibeam sleep monitoring with ISWI knockdown (KD) in all neuroblasts (NB) using worniu-GAL4 driver (blue) compared to elav-driven knockdown (red) and genetic controls (black and gray). Quantification of (B) total sleep duration, (C) night sleep duration, and (D) night sleep bout length in worniu-GAL4 > UAS-ISWI RNAi flies as measured by multibeam monitoring compared to elav-GAL4 > UAS-ISWI RNAi and genetic controls (n = 32, 32, 31, and 14 from left to right). (E) Representative images of FasII immunostaining of brains of worniu-GAL4 > UAS-ISWI RNAi flies. Scale bar, 50 μm. (F) Representative sleep traces for ISWI knockdown in different neuroblast lineages. Quantification of (G) total sleep duration and (H) night sleep duration with ISWI knockdown in different neuroblast lineages (from left to right: type I neuroblasts, n = 42, 43, 43, 42, and 47; type II neuroblast lineages, n = 42, 43, 43, 31, 30, 31, and 32. Asterisks denote significance compared to both the GAL4 only control and UAS-ISWI RNAi only control). Representative images of FasII immunostaining of brains with ISWI knockdown in (I) type I neuroblasts and (J) type II neuroblast lineages. Scale bars, 50 μm.