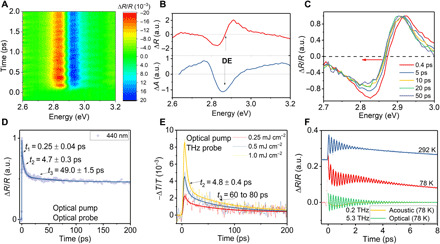
Fig. 3. Strong coherent phonons and ultrafast polaron formation.

(A) Pseudo color map of the TR profile of Cs2AgBiBr6 SC. (B) Top: The TR spectrum of Cs2AgBiBr6 SC monitored at 1-ps delay upon 500-nm excitation. Bottom: The transformed TA spectrum of Cs2AgBiBr6 SC using the Kramers-Kronig relations. (C) The recovery from the blue shift of the TR spectra at early delay time. (D) The TR kinetics of Cs2AgBiBr6 SC probed near the DE resonance at 440 nm in TRS measurement. (E) The terahertz transmission kinetics of Cs2AgBiBr6 PC in TRTS measurement. (F) Strong optical and acoustic modes coupled to the electronic dynamics probed near the isochromatic point (~2.83 eV). At room temperature (292 K), only the optical mode is obvious. At low temperature (78 K), the acoustic mode becomes apparent. Blue and red lines, fitted curves using Eq. 3; green line, extracted optical mode oscillations at 78 K; yellow line, extracted acoustic mode oscillations at 78 K.
