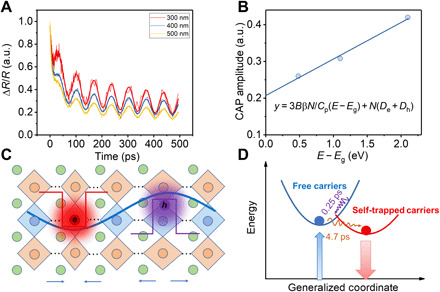
Fig. 4. Strong CAP and self-trapping by deformation potential.

(A) Normalized TR kinetics at 740 nm for Cs2AgBiBr6 SC upon different excitations (300, 400, and 500 nm) showing different relative CAP amplitudes. (B) A linear fit of the relative CAP amplitudes versus excitation energy to extract the deformation potentials. (C) A schematic of the self-trapping of charge carriers by acoustic phonons (deformation potential). The dots between adjacent perovskite octahedra represent the omitted lattice units for simplicity. (D) A schematic of the energy diagram for carrier self-trapping under the generalized coordinate.
