
Fig. 1. Adipose tissue clearing, labeling, and fluorescence microscopy for visualization of macrophage and CLS features.
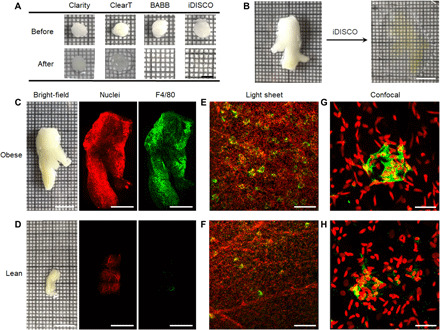
(A) Bright-field images of adipose tissue punches before and after treatment with four clearing techniques. All images share the same scale bar of 5 mm. (B) Bright-field images of intact perirenal adipose tissue before and after iDISCO clearing. Both images share the same scale bar of 1 cm. (C and D) Bright-field images of freshly dissected perirenal adipose tissue before clearing from both obese and lean mice and corresponding low-magnification light sheet microscopy images after iDISCO clearing. Tissues are stained with YO-PRO-1 nuclear dye (red) and a fluorescently labeled antibody against the macrophage F4/80 antigen (green). Scale bars, 10 mm for bright-field images and 5 mm for fluorescence images. (E and F) Zoomed light sheet microscopy images and (G and H) confocal fluorescence images for obese and lean tissues. Scale bars, 200 μm (E and F) and 20 μm (G and H). All fluorescence images are 3D projection images.