
Fig. 3. Macrophage identification in intact adipose tissues and in CLSs.
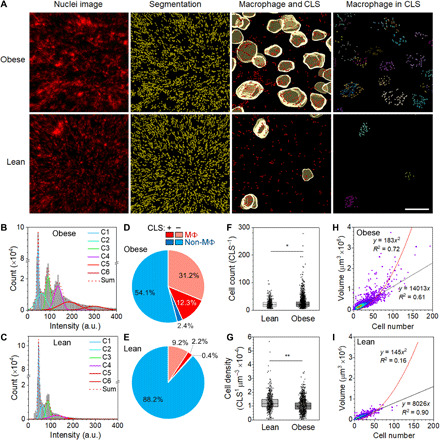
(A) Representative images of obese and lean adipose tissues showing raw nuclear image, nuclear segmentation, nuclei of cells classified as macrophages overlaid on CLS segments, and macrophages within CLSs. (B and C) Histograms show F4/80 intensity distribution across cells in obese and lean adipose tissues, in addition to six component Gaussian fittings. Plots show 10 million cells in obese adipose tissue and 5 million cells in lean adipose tissue. a.u., arbitrary units. (D and E) Cell populations in obese and lean adipose tissues, including macrophages (MΦ) and other cells (non-MΦ) within or not within CLSs. (F) Cell counts within CLSs from adipose tissues of lean and obese mice (*Mann-Whitney U < 0.0001). (G) Volumetric density of cells within each CLS calculated by dividing cell number by CLS volume (**Mann-Whitney U = 0.0038). In (F) and (G), boxes indicate 25th/75th percentile, black lines are mean values, whiskers are SDs. (H and I) Density plots of CLS volume versus cell number in adipose tissue of obese and lean mice. Linear and quadratic fits are shown with indicated coefficients of determination (R2). Linear fits only include data points up to 70 cells.