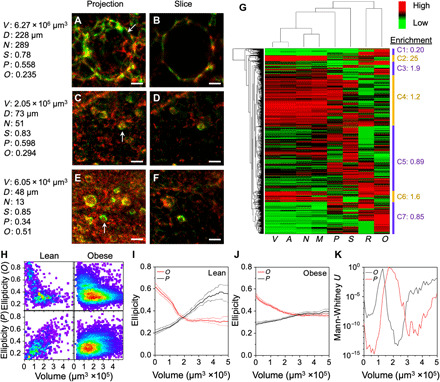
Fig. 4. Structural heterogeneity of CLSs.

(A to F) Representative 3D light sheet microscopy images of CLSs in adipose tissue showing both 3D projections and slices. Scale bars, 50 μm. The CLS volume (V), diameter (D), cell number (N), sphericity (S), oblate ellipticity (O), and prolate ellipticity (P) are listed. (G) Unsupervised hierarchical clustering of the CLS parameters in adipose tissue of obese and lean mice. The corresponding cluster of the representative CLSs in (A to F) is (A and B), C4; (C and D), C5; and (E and F), C7. (H) Density plots of CLS ellipticity for oblate (O) and prolate (P) shape classification versus volume in adipose tissue of obese and lean mice. (I and J) Mean oblate and prolate ellipticity is shown with 95% confidence intervals (shaded lines) for indicated volumes of lean CLSs (I) and obese CLSs (J) with rolling average of 1.5 × 105 μm3. (K) Mann-Whitney U test for comparison of oblate and prolate ellipticity between obese and lean CLSs with rolling 1.5 × 105 μm3 increment data binning across the indicated volumes.
