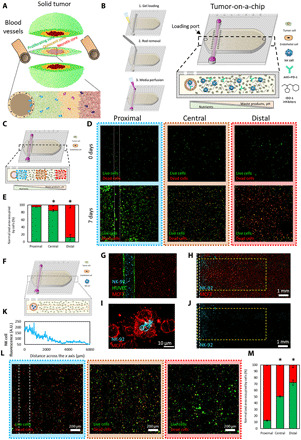
Fig. 1. Tumor-on-a-chip.

(A) Schematic representation of the different tumor phenotypes generated in a solid tumor due to nutrient starvation. (B) Scheme of the tumor-on-a-chip microdevice. The bottom panel shows the microdevice cross-section. The lumen was lined with endothelial cells (e.g., HUVECs) to generate a blood vessel surrogate, allowing the perfusion of medium, NK-92 cells, anti–PD-L1 antibodies (i.e., atezolizumab), or IDO-1 inhibitors (i.e., epacadostat). (C) Schematic representation of the microdevice, and the proximal, central, and distal regions are shown in blue, orange, and red, respectively. (D) Confocal images showing live and dead MCF7 cells in green and red, respectively, after 0 and 7 days in the device. (E) Area occupied by live cells (in green) and dead cells (in red) in the proximal, central, and distal regions. Asterisks denote P value of <0.05. (F) Scheme of the experimental setup. (G) Confocal image showing the dispersal of cells in the tumor-on-chip device. MCF7 cells (in red) are embedded in the collagen gel, while NK-92 cells (in blue) and HUVEC cells (in green) are embedded in the lumen. (H) This confocal image shows NK-92 cells (in blue) migrating across the chamber and MCF7 cells (in red). (I) Confocal image representing an NK-92 engaging with an MCF7. (J) This confocal image highlights the migration of NK cells out of the lumen and into the chamber. (K) Quantification of NK-92 migration across the x axis measured by NK cell fluorescence. A.U., arbitrary units. (L) MCF7 and NK-92 cells were cocultured for a week. The proximal region has a higher percentage of dead cells due to NK interaction close to the nutrient-rich lumen. (M) Quantification showing that distance from the lumen and the number of live cancer cells (in green) is proportional. Asterisk denotes P value of <0.05 compared with the proximal region; graphs show means ± SD.
